October 10, 2023
With earnings reports virtually dried up this week and wanting to stay on the bearish side, I had to go back a few weeks to find reports that failed to impress the Street. One name that popped up was a stock that we successfully played (28% profit) for a bullish winner back in March – Darden Restaurants (DRI), the sit-down restaurant chain conglomerate that includes Olive Garden, LongHorn Steakhouse, Capital Grille, and the recently acquired Ruth’s Chris Steak House.
DRI reported earnings a couple of weeks ago. The numbers were solid, as the company beat estimates on both the top and bottom lines. Same-restaurant sales also handily beat expectations. Moreover, sales and profits were higher than a year earlier. The only negatives were slowing growth in its fine-dining holdings and some concern over its aggressive expansion plans amid a potential recessionary environment.
Analysts seemed unmoved by the seemingly positive news. The report was met with a mix of target price upgrades and more numerous downgrades. This left the average target in the $160-170 range, well above Friday’s $137 close. With no ratings changes, analysts remain firmly in the buy/outperform camp.
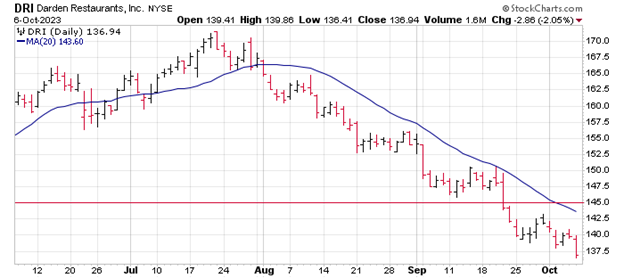
Perhaps analysts should take closer note of DRI’s stock chart and post-earnings performance. After hitting an all-time high in late July, the stock is down 21% and logged its lowest close in nearly a year on Friday. I’ll point out that the S&P 500 is down just 5% over the same time frame. This slump has been perfectly guided by the 20-day moving average, a trendline the stock hasn’t closed above in more than two months. Also, for technical wonks, the 50-day moving average is crossing below the 200-day moving average, also known as the “death cross.”
This bearish trade is based on the stock’s continued slump even after the good earnings results. With analysts perhaps too optimistic, it’s reasonable to expect some target price reductions, if not some ratings downgrades that could further pressure the share price.
Finally, the 20-day resistance is hard to ignore, which is why we’re playing a call spread with the short call strike sitting just above this trendline. Note that this trade has a smaller return than most because I wanted the short strike to be above the 20-day. Thus, we have a larger cushion of safety and greater probability of profit.

If you agree that the stock will continue its downtrend based on the resistance from its 20-day moving average (blue line), consider the following credit spread trade that relies on DRI staying below $145 (red line) through expiration in 6 weeks:
Buy to Open the DRI 17 Nov 150 call (DRI231117C150)
Sell to Open the DRI 17 Nov 145 call (DRI231117C145) for a credit of $0.85 (selling a vertical)

This credit is $0.02 less than the mid-point price of the spread at Friday’s $136.94 close. Unless DRI falls sharply at the open on Monday, you should be able to get close to that price.
The commission on this trade should be no more than $1.30 per spread. Each spread would then yield $83.70. This trade reduces your buying power by $500, making your net investment $416.30 per spread ($500 – $83.70). If DRI closes below $145 on Nov. 17, the options will expire worthless and your return on the spread would be 20% ($83.70/$416.30).
Happy trading,
Jon L
**Our QQQ portfolio is up more than 70% in 2023! Our MSFT portfolio is up around 30%! Overall, we’re beating the S&P. Don’t be left behind … now you can save more than 50% on a monthly subscription to Terry’s Tips. Just Click Here, select Sign Up Now and use Coupon Code D21M to start a monthly subscription to Terry’s Tips for half off.**

Follow Terry's Tips on Twitter
Like Terry's Tips on Facebook
Watch Terry's Tips on YouTube